Linux 面试题(山月)
如何获取一个进程的内存并监控
更多描述
在编写脚本时,有时会出现内存过大发生 OOM 的事情,那我们如何得知某个进程的内存?另外又如何监控它
Issue
欢迎在 Gtihub Issue 中回答此问题: Issue 4(opens new window)
Author
回答者: shfshanyue(opens new window)
通过 ps 可以获知一个进程所占用的内存
$ ps -O rss -p 3506
  PID   RSS S TTY          TIME COMMAND
 3506  6984 S pts/1    00:00:00 vim
如果要监控内存,需要使用对进程万能的命令 pidstat (PS: 这名字一听就知道是干嘛的)
# -r 显示内存信息
# -p 指定 pid
# 1: 每个一秒打印一次
$ pidstat -r -p 3506 1
Linux 3.10.0-957.21.3.el7.x86_64 (shanyue)      11/04/19        _x86_64_        (2 CPU)

20:47:35      UID       PID  minflt/s  majflt/s     VSZ    RSS   %MEM  Command
20:47:36        0      3506      0.00      0.00  139940   6984   0.18  vim
20:47:37        0      3506      0.00      0.00  139940   6984   0.18  vim
20:47:38        0      3506      0.00      0.00  139940   6984   0.18  vim
20:47:39        0      3506      0.00      0.00  139940   6984   0.18  vim
20:47:40        0      3506      0.00      0.00  139940   6984   0.18  vim
20:47:41        0      3506      0.00      0.00  139940   6984   0.18  vim
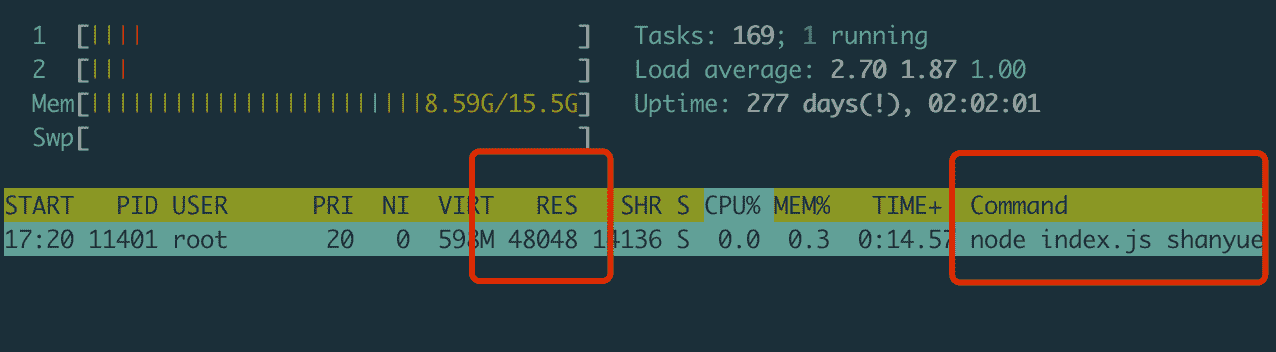
pidstat 是属于 sysstat 下的 linux 性能工具,但在 mac 中,如何定位内存的变化?此时可以使用万能的 top/htop
$ htop -p 31796
总结
简而言之,有以下三个命令
pidstat -r,只在 linux 环境下使用htop/top -pps -O rss -p
关于更多指标的监控可以参考我的文章: linux 各项监控指标小记(opens new window)
在 linux 中如何获取登录的用户
Issue
欢迎在 Gtihub Issue 中回答此问题: Issue 29(opens new window)
Author
回答者: shfshanyue(opens new window)
$ who

$ last
linux 中如何打印所有网络接口
Issue
欢迎在 Gtihub Issue 中回答此问题: Issue 31(opens new window)
Author
回答者: shfshanyue(opens new window)
ifconfig
ifconfig 是最简单最常用,但是打印信息太多了
$ ifconfig
cni0: flags=4163<UP,BROADCAST,RUNNING,MULTICAST>  mtu 1450
        inet 10.244.0.1  netmask 255.255.255.0  broadcast 0.0.0.0
        ether 9e:f3:9e:47:9d:55  txqueuelen 1000  (Ethernet)
        RX packets 14733665  bytes 1007493238 (960.8 MiB)
        RX errors 0  dropped 0  overruns 0  frame 0
        TX packets 15040396  bytes 4534954611 (4.2 GiB)
        TX errors 0  dropped 0 overruns 0  carrier 0  collisions 0

docker0: flags=4099<UP,BROADCAST,MULTICAST>  mtu 1500
        inet 172.18.0.1  netmask 255.255.0.0  broadcast 172.18.255.255
        ether 02:42:09:fe:1d:e5  txqueuelen 0  (Ethernet)
        RX packets 0  bytes 0 (0.0 B)
        RX errors 0  dropped 0  overruns 0  frame 0
        TX packets 0  bytes 0 (0.0 B)
        TX errors 0  dropped 0 overruns 0  carrier 0  collisions 0
netstat
netstat 与 ip 也挺好用,特别是它们还可以打印路由表
$ netstat -i
Kernel Interface table
Iface             MTU    RX-OK RX-ERR RX-DRP RX-OVR    TX-OK TX-ERR TX-DRP TX-OVR Flg
cni0             1450 14733471      0      0 0      15040202      0      0      0 BMRU
docker0          1500        0      0      0 0             0      0      0      0 BMU
eth0             1500 42833038      0      0 0      40961577      0      0      0 BMRU
flannel.1        1450  4761436      0      0 0       4091581      0      0      0 BMRU
lo              65536 376447249      0      0 0      376447249      0      0      0 LRU
veth2052e2d6     1450  7358995      0      0 0       7518642      0      0      0 BMRU
veth3190806e     1450  7363232      0      0 0       7510100      0      0      0 BMRU
ip
$ ip link

$ ip addr
linux 有哪些发行版,你最喜欢哪一个
Issue
欢迎在 Gtihub Issue 中回答此问题: Issue 38(opens new window)
Author
回答者: zhangzl419(opens new window)
我最喜欢的 Linux 发行版是 Centos,第二喜欢的是 Ubuntu。Centos 在服务器上很好用,Ubuntu 做开发环境很好用。
Author
回答者: shfshanyue(opens new window)
我最喜欢的 Linux 发行版是 Centos,第二喜欢的是 Ubuntu。Centos 在服务器上很好用,Ubuntu 做开发环境很好用。
用的人多,就好用了。(不过我装 tmux 和 vim 都需要从源码编译
linux 的发行版,可以在 https://distrowatch.com 查询
因为平常工作都在 windows 环境下,只有部署的时候才会用到 linux 我司用到的 linux 为 centos 7 版本,比较稳定 我最喜欢的是 deepin,在业余时间接触过这个,图形化的界面很舒服,唯二的缺点是驱动问题和软件源问题
CoW 策略指什么,docker 中有哪些应用
Issue
欢迎在 Gtihub Issue 中回答此问题: Issue 42(opens new window)
如何使用命令查看一个文件有多少字符以及多少行
Issue
欢迎在 Gtihub Issue 中回答此问题: Issue 44(opens new window)
Author
回答者: shfshanyue(opens new window)
wc,及 word count,用以统计一个文件的行数、单词数、字符数及文件大小
# 97 - lines
# 177 - words
# 5087 - bytes
$ wc Readme.md
97  177 5087 Readme.md

# -m 用以统计字符数
$ wc -m Readme.md
3107 Readme.md
相关问题:
如何在 linux 中打印所有环境变量
Issue
欢迎在 Gtihub Issue 中回答此问题: Issue 56(opens new window)
Author
回答者: shfshanyue(opens new window)
$ printenv
XDG_SESSION_ID=10536
HOSTNAME=shanyue
TERM=xterm-256color
SHELL=/bin/bash
HISTSIZE=1000
SSH_CLIENT=124.200.184.74 16003 22
SSH_TTY=/dev/pts/0
如何用 linux 命令输出文件的特定行
Issue
欢迎在 Gtihub Issue 中回答此问题: Issue 71(opens new window)
Author
回答者: shfshanyue(opens new window)
通常使用 sed 命令打印特定行,如
# -n: 按特定格式打印
# 100p: 指打印第一百行
$ sed -n 100p Readme.md
但 sed 打印的本领,远不止于此,除了打印特定行,还可以打印一段范围的行,如
# 打印文件中第 100-120 行
$ sed -n 100,120p Readme.md

# 打印文件中第 100-120 行
$ sed -n 100,+20p Readme.md
还有一种本办法,head/tail 的组合命令,以要输出第 100 行为例
# 输出前100行,再通过 pipe,输出最后一行
$ head -100 Readme.md | tail -1
关于 sed 更多的用法可以参考我的文章: sed 命令详解及示例(opens new window)
总结
两种方法
sed -n 100p Readme.mdhead -100 Readme.md | tail -1
cron 表达式 (_ 10 _ * *) 会如何触发
Issue
欢迎在 Gtihub Issue 中回答此问题: Issue 97(opens new window)
Author
回答者: shfshanyue(opens new window)
每天十点,每分钟都会执行一次
cron 表达式 (30 10 * * *) 会如何触发
Issue
欢迎在 Gtihub Issue 中回答此问题: Issue 98(opens new window)
Author
回答者: shfshanyue(opens new window)
每天十点半执行一次
在 linux 中如何查看 cron 执行的情况
Issue
欢迎在 Gtihub Issue 中回答此问题: Issue 99(opens new window)
Author
回答者: shfshanyue(opens new window)
在 centos 中,查看日志文件
$ tail -f /var/log/cron
Dec  5 19:30:01 8 CROND[24068]: (root) CMD (echo hello, world)
Dec  5 19:31:01 8 CROND[24084]: (root) CMD (echo hello, world)
Dec  5 19:31:01 8 CROND[24083]: (root) CMD (echo hello)
Dec  5 19:32:01 8 CROND[24094]: (root) CMD (echo hello, world)
Dec  5 19:32:01 8 CROND[24093]: (root) CMD (echo hello)
Dec  5 19:33:01 8 CROND[24104]: (root) CMD (echo hello, world)
Dec  5 19:33:01 8 CROND[24103]: (root) CMD (echo hello)
Dec  5 19:34:01 8 CROND[24113]: (root) CMD (echo hello)
Dec  5 19:34:01 8 CROND[24114]: (root) CMD (echo hello, world)
如何查看一个文件的 inode number
Issue
欢迎在 Gtihub Issue 中回答此问题: Issue 115(opens new window)
Author
回答者: shfshanyue(opens new window)
可以使用 ls 或者 stat
$ stat hello.txt
  File: ‘hello.txt’
  Size: 30              Blocks: 8          IO Block: 4096   regular file
Device: fd01h/64769d    Inode: 917526      Links: 1
Access: (0644/-rw-r--r--)  Uid: (    0/    root)   Gid: (    0/    root)
Access: 2019-12-10 16:15:55.253325208 +0800
Modify: 2019-12-10 16:15:52.740653330 +0800
Change: 2019-12-10 16:15:52.742653069 +0800

$ ls -i hello.txt
917526 hello.txt
文件系统中 mtime、ctime 和 atime 指什么,都有什么不同
Issue
欢迎在 Gtihub Issue 中回答此问题: Issue 116(opens new window)
Author
回答者: shfshanyue(opens new window)
在 linux 中,
mtime:modified time指文件内容改变的时间戳ctime:change time指文件属性改变的时间戳,属性包括mtime。而在 windows 上,它表示的是creation time
所以 ctime 会比 mtime 要大一些,使用 stat 查看文件属性如下
$ stat hello.txt
  File: ‘hello.txt’
  Size: 30              Blocks: 8          IO Block: 4096   regular file
Device: fd01h/64769d    Inode: 917526      Links: 1
Access: (0644/-rw-r--r--)  Uid: (    0/    root)   Gid: (    0/    root)
Access: 2019-12-10 16:15:55.253325208 +0800
Modify: 2019-12-10 16:15:52.740653330 +0800
Change: 2019-12-10 16:15:52.742653069 +0800
 Birth: -
而 http 服务选择 Last_Modified 时一般会选择 mtime
shell 中 ${} 与 $() 各是什么意思
Issue
欢迎在 Gtihub Issue 中回答此问题: Issue 130(opens new window)
Author
回答者: shfshanyue(opens new window)
${}变量$()命令
如何判断端口是否可达
Issue
欢迎在 Gtihub Issue 中回答此问题: Issue 146(opens new window)
Author
回答者: shfshanyue(opens new window)
使用 nc,-z 指测试接口连通性
nc -vz localhost 443
如何禁止服务器被 ping
Issue
欢迎在 Gtihub Issue 中回答此问题: Issue 163(opens new window)
Author
回答者: iSenninha(opens new window)
echo "1" > /proc/sys/net/ipv4/icmp_echo_ignore_all
How do I disable ping responses from my system? (opens new window)
在服务器内如何得知自己的公网 IP
Issue
欢迎在 Gtihub Issue 中回答此问题: Issue 172(opens new window)
Author
回答者: shfshanyue(opens new window)
有现成的公网 IP 服务提供,根据 TCP 连接获得真实 IP 地址
$ curl ifconfig.me
ssh 如何设置 IP whiteList
Issue
欢迎在 Gtihub Issue 中回答此问题: Issue 180(opens new window)
如何判断文件中的换行符是 LF 还是 CRLF
Issue
欢迎在 Gtihub Issue 中回答此问题: Issue 200(opens new window)
如何查看 node_modules(某一文件夹) 的体积有多大
Issue
欢迎在 Gtihub Issue 中回答此问题: Issue 278(opens new window)
Author
回答者: shfshanyue(opens new window)
du (disk usage) 命令可以查看磁盘的使用情况,从它可以看出来文件及目录的大小
# -d 搜索深度,0 指当前目录
# -h 以可读性的方式显示大小
$ du -hd 0 node_modules
132M    node_modules
同理,可以使用以下命令查看 node_modules 下每个目录所占的大小
$ du -hd 1 node_modules
服务器的平均负载如何计算
Issue
欢迎在 Gtihub Issue 中回答此问题: Issue 299(opens new window)
Author
回答者: shfshanyue(opens new window)
load average 指单位时间内运行态进程及不可中断进程的平均进程数,运行态进程指正在使用或者 等待使用 CPU 的进程,不可中断进程指正等待一些 IO 操作的进程。可使用 uptime 查看此指标。
$ uptime
 16:48:09 up 2 days, 23:43,  2 users,  load average: 0.01, 0.21, 0.20
多服务器的系统时间不一致如何解决
Issue
欢迎在 Gtihub Issue 中回答此问题: Issue 304(opens new window)
Author
回答者: vincent-sk(opens new window)
ntp 服务
什么是 CPU 缓存,如何查看缓存命中率
Issue
欢迎在 Gtihub Issue 中回答此问题: Issue 414(opens new window)
Author
回答者: edisonwd(opens new window)
CPU 缓存介于 CPU 和内存之间,缓存的是热点的内存数据。这些缓存按照大小不同分为 L1、L2、L3 等三级缓存,其中 L1 和 L2 在同一个 cpu 核中, 而在同一个 CPU 插槽中的多个核共享一个 L3 缓存。
缓存命中率,即直接通过缓存获取数据的请求次数,占所有数据请求次数的百分比。当可以直接通过缓存获取到需要的数据,则命中缓存;否则需要从磁盘等地方读取获取数据。缓存命中率越高,表示直接从缓存获取数据的次数越多,程序执行效率越高。 使用 cachestat 可以查看整个个操作系统缓存的读写命中情况: cachestat 安装方式: sudo apt install perf-tools-unstable
下面以 1 秒间隔输出三组缓存信息:
$ sudo cachestat 1
Counting cache functions... Output every 1 seconds.
    HITS   MISSES  DIRTIES    RATIO   BUFFERS_MB   CACHE_MB
    1989        0       13   100.0%          501       2600
   12969        0     1412   100.0%          501       2600
   16798        0     2803   100.0%          501       2600
从结果可以看到,HITS 是缓存命中的次数;MISSES 是缓存未命中的次数;DIRTIES 是表示新增到缓存中的脏页数;BUFFERS_MB 表示 Buffers 的大小,单位为 MB;CACHED_MB 表示 Cache 的大小,单位为 MB。
什么是 exit code
Issue
欢迎在 Gtihub Issue 中回答此问题: Issue 424(opens new window)
Author
回答者: shfshanyue(opens new window)
exit code 代表一个进程的返回码,通过系统调用 exit_group 来触发。在 POSIX 中,0 代表正常的返回码,1-255 代表异常返回码,一般主动抛出的错误码都是 1。
这里有一张关于异常码的附表 Appendix E. Exit Codes With Special Meanings(opens new window)。
异常码在操作系统中随处可见,以下是一个关于 cat 命令的异常以及它的 exit code,并使用 strace 追踪系统调用。
$ cat a
cat: a: No such file or directory

# 使用 strace 查看 cat 的系统调用
# -e 只显示 write 与 exit_group 的系统调用
$ strace -e write,exit_group cat a
write(2, "cat: ", 5cat: )                    = 5
write(2, "a", 1a)                        = 1
write(2, ": No such file or directory", 27: No such file or directory) = 27
write(2, "\n", 1
)                       = 1
exit_group(1)                           = ?
+++ exited with 1 +++
从系统调用的最后一行可以看出,该进行的 exit code 是 1,并把错误信息输出到 stderr (标准错误的 fd 为 2) 中
如何查看 exit code
从 strace 中可以来判断进程的 exit code,但是不够方便过于冗余,特别身处 shell 编程环境中。
有一种简单的方法,通过 echo $? 来确认返回码
$ cat a
cat: a: No such file or directory

$ echo $?
1
什么是 coredump,如何配置与分析
Issue
欢迎在 Gtihub Issue 中回答此问题: Issue 425(opens new window)
